Unreal Engine provides a wealth of realtime performance information, including a range of in-editor stat console commands. It’s through windows such as these that you’re able to see a breakdown of your project’s frame time, as well as graphs that plot this data over time.
However, despite their usefulness the visibility on most of these tools is limited to us as developers. If you want to share performance data with your players you’ll need to do a little more work.
To create a player-facing framerate counter in Unreal you’ll need to divide 1 by delta time to calculate the framerate, and then use Widget to display the result. Creating a graph that plots this data over time is a little more involved, but the entire system can be created in under an hour.
Download the Unreal project
If you’d like to unpack the Unreal Project I used in this tutorial for yourself to see how it works, you can download it for free from my GitHub page. Feel free to use it within your own projects. I hope it proves useful!
The rest of this tutorial will explore different ways to interpret your framerate data, as well as one method to usefully present it to your players.

Table of Contents
Presenting the Stats
As always with player-facing information, context is super important. Even in tightly optimized games it’s normal for framerate to fluctuate, and to give players a solid grasp of your game’s performance you’ll need to think carefully about how you communicate this information.
In my (highly subjective) opinion the best approach is the one taken by popular first-person shooter Valorant, which provides a succinct and highly customizable window into its framerate (as well as a bunch of other useful data, which we might also get to explore one day).
It’s such a good idea we’re going to be stealing borrowing it.
Widget Setup
Let’s get started by creating a new Widget Blueprint to contain all of the logic for calculating and presenting framerate information. I’m calling mine WBP_FPSDisplay.
Within this Widget’s Designer Mode I’m doing to add a number of elements under a parent Canvas Panel. This will be our ‘stats panel’ which displays the following information:
| FPS | The current framerate (1/delta time) |
| AVG | The average framerate over an arbitrary period of time (the same duration is used by the graph) |
| MIN | The minimum recorded framerate since play began |
| MAX | The maximum recorded framerate since play began |
The hierarchy of these Widgets isn’t strictly important and you should feel free to format this data however way you like. This is how I laid mine out, but remember if you’d rather not have to set all of this up yourself you can always grab the project from my Github and copy/paste it across.
- Stats (Vertical Box)
- FPS_Box (Horizontal Box)
- FPS_Label (Text)
- FPS_Value (Text)
- AVG_Box (Horizontal Box)
- AVG_Label (Text)
- AVG_Value (Text)
- MIN_Box (Horizontal Box)
- MIN_Label (Text)
- MIN_Value (Text)
- MAX_Box (Horizontal Box)
- MAX_Label (Text)
- MAX_Value (Text)
- FPS_Box (Horizontal Box)
| Text field | Default value |
|---|---|
| FPS_Label | FPS: |
| FPS_Value | ### |
| AVG_Label | AVG: |
| AVG_Value | ### |
| MIN_Label | MIN: |
| MIN_Value | ### |
| MAX_Label | MAX: |
| MAX_Value | ### |
Components highlighted in bold will need to be have their Is Variable checkboxes ticked as we’ll soon be referencing them in the Event Graph.

Blueprint Logic
Let’s jump over into the Event Graph now and create a few simple functions to get things up and running. The first is called UpdateStats and it contains the logic for calculating the FPS, AVG, MIN and MAX values. To set this up we’ll need to create the following variables:
Config
| MaxNumberOfStatPoints (int) | The maximum length of the StatsRange array. The larger this value the more data points will be collected and the higher the impact on performance. Set to 32 by default. |
| MinTargetFPS (int) | Your minimum acceptable framerate. Set to 30 by default. |
| MaxTargetFPS (int) | Your target framerate. Set to 60 by default. |
| TargetFPSCurve (color curve) | A color curve for tinting stat values |
| UpdatePeriod (float) | The time in seconds between updates. Set to 0.03 by default, making it update roughly 30 times a second. |
Other Data
| StatsRange (int array) | A history of data points used to calculate the average framerate |
| CurrentFPS (int) | The current framerate |
| MinFPS (int) | The lowest framerate occurring within the history range. Don’t forget to set this to an absurdly high number like 9999. |
| MaxFPS (int) | The highest framerate occurring within the history range |
Our FPS Display relies on collecting framerate information over an arbitrary period of time, and it does this by adding the current framerate to a StatsRange array every x seconds. As the array hits its maximum length as defined by MaxNumberOfStatPoints it’ll discard the oldest value, giving us a constantly updating recent history of our game’s framerate. We then use this history to set the text value for each stat.

You’ll notice I’m also using a small pure function called GetTextColor to help me change the text color of both Value and Label based on the Max/MinTargetFPS values. This is just for easier readability, as its important for players to get a good sense of your game’s performance with just a quick glance.


Now we just need to get our UpdateStats function firing periodically to update these values at runtime. I do this with a Set Timer By Function Name function that gets triggered on Event Construct. The UpdatePeriod is up to you, but keep in mind that the smaller the value the greater the performance impact.

Heads up
This method completely discards framerate values between updates, which means that if your fps is fluctuating wildly it may incorrectly report min/max/average values. I think this is an understandable tradeoff in accuracy for a more stable/performant value, but it’s best to keep this margin of error in mind.

Creating the Graph
Now we’ve got our stats data its time to present it to our players in a way they’ll find most useful. Creating a graph readout doesn’t take that much additional logic, but it does involve a little more fiddling around within our WBP_FPSDisplay Widget.
Widget Setup
Back in Designer View, we’re going to add a few more elements under a new Canvas Panel parent. The size/shape of this one is up to you, but keep in mind we’ll be using its position and scale to define where the graph’s line is drawn.
The graph parent needs to be made a variable to we can reference it in the Event Graph, as do two new Text Widgets for the graph’s min/max value.
- Graph (Canvas Panel)
- GraphMax_Text (Text)
- GraphMin_Text (Text)

a semi-transparent black background and white borders.
Blueprint Logic
Returning to the Event Graph for the final stretch. We’ll be working in a new function called UpdateGraph and creating two additional variables.
| GraphBorder (int) | An offset in pixels for the borders of the graph, set to 4 by default. |
| GraphCoordinates (vector 2D array) | An array of points used to draw the graph in segments (value 0 to 1, 1 to 2, etc.) |
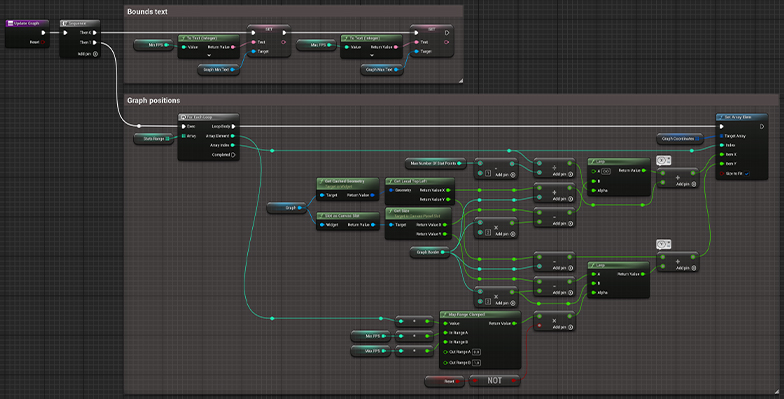
In UpdateGraph we use the StatsRange array to plot the points we’ll later use to draw the graph line. It’s also in here that we set the GraphMin/Max_Text values to show the bounds of what the graph represents.

Don’t forget that you’ll need to add UpdateGraph to the UpdateStats function, or it won’t work! The call needs to happen at the end of the UpdateStats chain, allowing the Blueprint to finish the stats calculation before we use it to create the graph line.
If you want your graph line to start flat you’ll also need to manually fill in the graph points when the Widget is constructed. Here is how I did that.

OnPaint
All that’s left is to draw our line. We do this by overriding a function called OnPaint, which allows us to draw directly to the screen.

Inside OnPaint all we need to do is feed our GraphCoordinates array straight into a Draw Lines function. Set whatever line thickness/color you think best, and you’re done!

Adding the FPS Display to the Viewport
To see the framerate display in-game you’ll need to add the Widget to your player’s viewport. This is best done inside the Player Controller. Adding options to toggle the visibility of the display (or parts of the display) is up to you.

What’s next?
Thanks a lot for following along! I hope you found this tutorial useful, and that it provides your players with a practical stat graph they can use to debug your game’s performance.
If you have any questions or ideas to improve the fps display, please let me know! You can reach me here via techarthub’s Contact page, or if you’d prefer drop into our Discord Server – we’re a friendly bunch!
I’m excited to continue developing this system in the future by further reducing its impact on performance, and through the addition of other useful stats like memory consumption. I’m working on a multiplayer game at the moment so I’d also love to develop future graphs that can present net statistics as well.
Who knows, maybe I’ll even find a different game to lift ideas from inspire me.


